In addition, hundreds of hospitals across the country are facing aging equipment. It is difficult for them to repair these facilities or rebuild them in new places. Many of these hospitals were built in the early 20th century. Residential areas have developed around, which has limited their footsteps and seriously hindered the expansion of the hospital. (This refers to the US hospital, translator's note)
problem
CMC is a community hospital with 425 beds in a metropolitan area. There are also 12 hospitals located here, and the competition is fierce. Like many small hospitals, CMC has many buildings that have been in existence for 50 years, with the three most important buildings being 50, 30 and 15 years old. These three buildings are double wards.
The rapid development of hospitals exceeds the capacity of their facilities. In the past year alone, CMC had to transfer 450 patients to other hospitals, resulting in a loss of $1.6 million. Figure 1.1 shows the average daily CMC and explains why the hospital's bed is not enough.
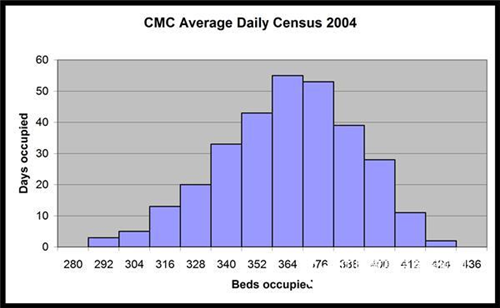
Figure 1.1 CMC Daily Average
Regarding hospital capacity, the hospital CEO asked the planning team to assess the number of people leaving the hospital in the next 10 years. The planning department used Excel's linear regression function to perform trend line analysis and plotted the chart in Figure 1.2. By applying a Poisson distribution to the 35,000 hospitals, the planner concluded that 514 beds were needed. Instead of adjusting for the average length of hospital stay for patients over the past 10 years, they assumed that they remained the same, as shown in Figure 1.3.
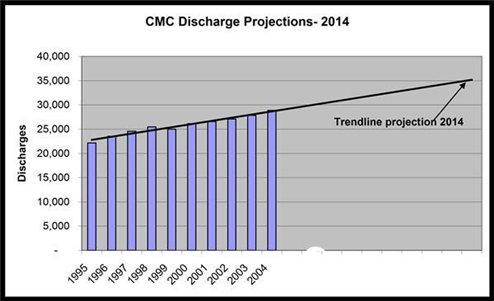
Figure 1.2 CMC forecast
Because of the potential need for 95 beds, the board asked the CEO to prepare an initial feasibility report. The manager first consulted an architect who designed several small buildings for the hospital to estimate the cost of adding 95 beds to the existing campus. The architect estimated that the cost of repairing the existing building and adding 95 new beds would be $260000000. In order to accommodate new beds in the original courtyard, all rooms must be double rooms. The most popular single rooms today cannot exist.
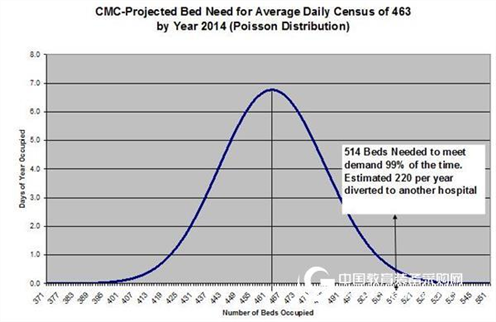
Figure 1.3 CMC forecast
In 1990, the hospital's board of directors faced a similar problem, namely whether to increase the number of beds in the existing courtyard or re-site. The board of directors decided to invest $90 million to expand on the original site. Faced with today's dilemma, many board members in 1990 thought they should better analyze the future situation. One of the members regretted that there was no additional site to build another courtyard. They are well aware that their current decision to repair and increase the number of beds in the original hospital area or to relocate will affect the hospital's development in the next 30 to 50 years.
There is no place available in the urban area (minimum 25 acres), but in the neighbouring suburbs, the hospital spent $110 million near the mobile medical center that was built 5 years ago. However, considering the uncertainty of the investment in existing campuses and the impact of new hospitals on market share, it is really hesitant to build new campuses.
The board has other considerations. In the past, every time a hospital tried to expand, it always involved a lawsuit. The owner of the adjacent property failed to oppose the construction of the emergency center in 1999, but he actually delayed the construction for three years through various legal channels. This obviously increases construction costs and generates revenue losses because no modern facilities are available.
Two board members participated in a conference on the future development of the hospital, pointing out that building more double rooms is not a suitable decision for the following reasons:
By the time all facilities are ready to begin construction, regulations may stipulate that new hospitals must be single rooms. Patients prefer single rooms, and CMC will be at a competitive disadvantage if compared to other hospitals that have been converted to single rooms. In the case of a single room, fewer patients need to be transferred, so fewer staff are needed. The infection rate will be significantly reduced.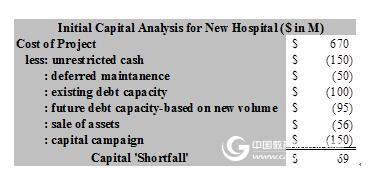
Figure 1.4 CMC analysis results
Upon receipt of the initial cost assessment report for a new hospital, the hospital's CFO presented the results of the analysis shown in Figure 1.4 to the Finance Committee for an initial review of the project's feasibility. The construction cost of the preliminary design of the new hospital is estimated to be $670000000. The study also showed that if you no longer finance existing buildings, you can save about $50000000. If the planning department's hospital capacity is designed accurately and the income and expenditures for each patient are the same, the CFO expects the hospital to increase its debt serviceability by $95 million. A portion of the cost will be offset by selling various properties of the hospital and conducting large fundraising activities. In the past few years, the hospital has some office buildings and some clinics in the suburbs that can be transformed into new ones. In addition, there is a demand for residential properties in the urban area, so the location of the hospital is estimated at $17000000. Although not sure, the CFO believes that through additional analysis, the hospital is likely to overcome the $69 million funding shortfall.
The board of directors authorizes management to consult with construction companies outside the region. The selection committee believes that they need to choose a company that can better assess risk and make trade-offs because of the potential risks of building an unsuitable facility in the wrong location. At the same time, before the analysis was completed, the committee invested in a one-year option for a 25-acre suburban property in a safe haven. After a national inspection, CMC selected a nationally renowned construction company and Stroudwater Associates to analyze the project, with strategic planning and analysis partially falling into the Stroudwater capsule.
analysis
Stroudwater first tested the trendline analysis done by CMC Planning, and then combined qualitative and quantitative predictions instead of using simple trend lines based on past patient data. Before completing the financial planning, you need to better estimate the number of beds you need. Stroudwater divides the factors affecting bed demand into five parts: demographic trends, changes in usage methods, market share, patient hospitalization time, and queue management. Due to the rapid changes in medical technology, it is certain that more than 10 years of predictions are risky, and the board believes that 10 years is appropriate for the analysis. In addition, the hospital also wants to plan for at least three years after the completion of the hospital construction. Because at least for the next 10 years, and including a large number of variables, Stroudwater applied Monte Carlo simulation techniques to the five influencing factors, as shown in Figure 1.5.
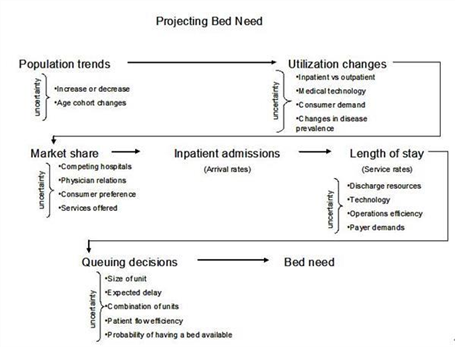
Figure 1.5 Monte Carlo simulation
As a quality management investment, the hospital established a 15-person steering committee, which includes medical personnel, directors and key management personnel. During the four-month study, the committee met every three weeks and Stroudwater voted regularly to determine major issues throughout the process.
In addition, Stroudwater conducted 60 interviews with physicians, board members and key management personnel. When interviewed with key physicians in each of the major service departments, Stroudwater's consultants were surprised that many older physicians were practicing alone and were not looking for someone to replace them, which is a significant risk for CMC. The CFO also found another problem: most physicians in key areas of hospitals have recently refused to accept insurance transfers, which has increased hospital risk, while physicians hired by major competitors accept insurance transfers from all payers.
To better understand which service sectors are at risk, Stroudwater produced a bubble chart (Figure 1.6) to highlight areas that require further planning before doing market share assessment. The three variables in the figure are pure income, operating profit margin and a set of subjective risk assessment systems.
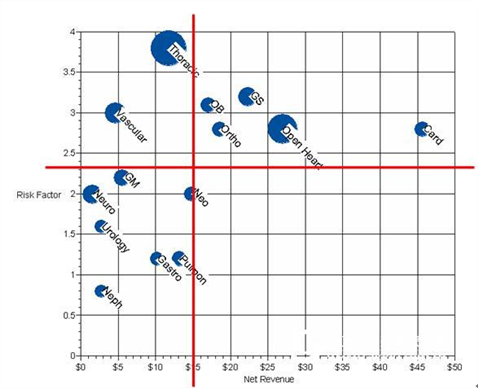
Figure 1.6 Bubble chart
We identified five risk factors, assigned a certain weight to each factor, and rated it as one to five, then marked on the y-axis:
The scale of practice - the percentage of each individual physician practice and dual physician practice areas. The average age of a physician in a professional field. Competitive threats from other hospitals. The proportion of patients outside the service area. Proportion of physicians who accept insurance transfers in various fields.The analysis reveals five key areas – orthopedics, obstetrics, general surgery, open heart surgery, cardiology – where CMC's profit and loss is at risk, but they are The future offers the greatest profit opportunities. In order to better market share assessment, Stroudwater conducted a small business plan for each of the areas in the upper right quadrant of Figure 1.6.
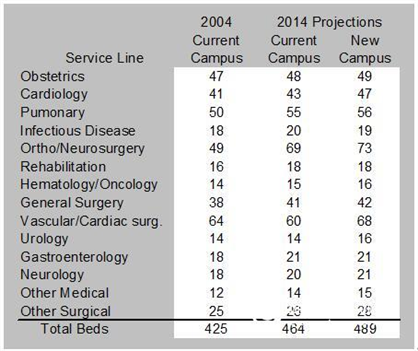
Population Development Trends To determine the future population of the CMC service area, Stroudwater consulted a nationally recognized company specializing in population trend research. Because hospital resources for patients over 65 years of age are three times higher than other populations, a very important factor is to consider the continued impact of baby boomers. Stroudwater also asked members of the Steering Committee to review the 2014 population projections and decide what other factors should be considered but not included in the professional plan.
The members of the committee made a few comments. Major equipment manufacturers may transfer their operations to China, resulting in a reduction of 3,000 jobs in the original service area. However, a new computer chip manufacturer may enter the region. Stroudwater illustrates the accidental events of these populations/employments using conventional distribution.
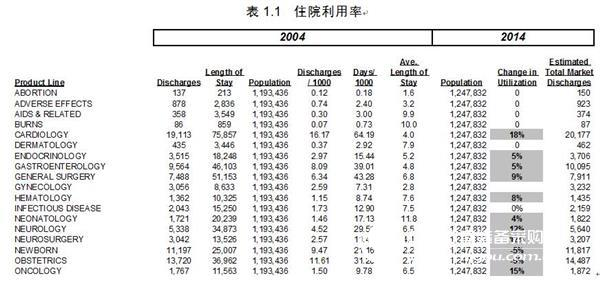
After the resource utilization plan completed the population forecast, Stroudwater turned its attention to calculating the number of discharges per 1,000 people, which is also a highly uncertain figure. To establish a baseline for future planning, the 2004 discharge data from the State Hospital Association was used to calculate the hospitalization rate (displacement per 1,000 people) in the market where CMC is located. Stroudwater calculated hospitalization utilization in 34 different areas, see Table 1.1.
Table 1.1 Hospitalization Utilization
Stroudwater takes into account some of the market forces affecting hospital bed usage in the utilization trend analysis. These consultants believe that the following key factors will reduce bed usage:
A better understanding of the risk factors for disease and increasing prevention initiatives (eg smoking prevention programs, cholesterol-lowering drugs). Discovery/implementation of medical methods that can cure or eliminate disease. It is recommended to reduce the protocol documents or guidelines for bed use. Reduced use of the original location due to transfer to other locations Technology allows for transfer (eg, mobile surgery). Alternative medical locations available (eg, assisted living). Changing style of practice (eg encouraging self-treatment and a healthy lifestyle, shortening the length of hospital stay). The development of technology.Stroudwater also considers the following factors that increase the use of hospital beds:
The ageing population is growing. New procedures or techniques (eg hip replacement, stent placement, MRI). It is recommended to increase the protocol documents or guidelines for bed use. The emergence of new diseases (such as AIDS, bioterrorism). Increase in medical insurance coverage. Changes in consumer choices and needs (eg, bariatric surgery, hip and knee replacement surgery).In all major high-capacity service areas, Stroudwater's consultants adjusted the changes in bed usage and embedded them into the worksheet model, a process that combines uniform distribution, triangular distribution, and normal distribution.
The Market Share Steering Committee asked Stroudwater to model two situations, one to repair the building and add a bed in the original yard, and the other to completely build a new one in the suburb. In order to predict the possible number of CMC discharges in 2014, market share assumptions must be made for each of the major service areas in both cases.
The standard market share analysis divides the primary and secondary service markets by administrative region based on market share. Stroudwater, on the other hand, divides the service area into six different market clusters based on market share, geographical location and historical travel.
Stroudwater selected eight major service areas covering 80% of admissions for further analysis and invited committee members and key physicians in each area to conduct market share planning. Committee members and participating physicians attended a conference where CMC planning staff and Stroudwater consultants jointly demonstrated a small business plan. Subsequent discussion of local market trends and findings on past patient preferences. As a result of the meeting, participants agreed to focus on specific factors to assist them in assessing market share, including:
Changes in patient preferences. The proximity of other competing hospitals. The halo effect of the new hospital. Changes in local physician selection preferences in the hospital. The ability to hire a physician and retain a physician.Using a customized survey tool, Stroudwater provides survey participants with market share trend data for the next four years and asks them to perform the worst, most likely and best for each of the eight service areas and each market cluster under each campus design. Estimation of the situation.
After sorting out the survey results, Stroudwater assigns a triangular distribution to each variable. In the process, everyone had some different opinions about heart surgery. Hospitals that compete with CMC may open a cardio-thoracic surgery department in CMC's secondary service market, and there is a lively discussion about its impact. In the case of “existing campusesâ€, the Steering Committee believes that the emergence of this competitive sector will reduce market share by 15% to 19%, and the probability of competitors opening the sector is 20%. If competitors do not open such a department, a few people think that CMC's market share will increase significantly by 27% to 30%; and this probability is 30%. The rest of the members are more conservative, they estimate the market share is 23% to 25%. Similarly, they also evaluated the situation in the new residential area. Participants felt that the market opportunity was better, and if the competition hospital opened a new cardio department, the loss of CMC would be alleviated.
Stroudwater uses the conventional distribution shown in Figure 1.7.
The average length of hospital stay Stroudwater used the National Medical Data Center's National Hospital Discharge Survey Historical Statistics and CMC's actual data to conduct a hospitalization period assessment for 400 diagnostically relevant groups.
The primary CMC physicians also participated in the assessment of hospitalization duration based on baseline data, their respective field of expertise, and CMC historical data. Stroudwater consultants conducted a trend analysis of historical hospitalization periods and developed a metric benchmark data and an algorithm evaluated by CMC physicians. They then integrated the hospitalization period estimate into one distribution for each of the major service areas.
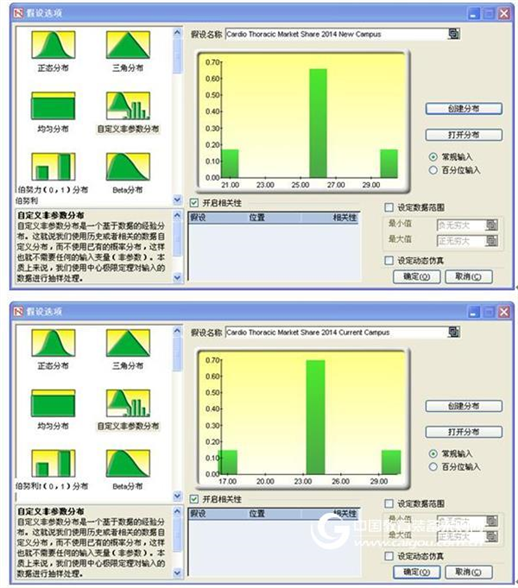
Figure 1.7 Hypothetical options
At this point, Stroudwater conducted a sensitivity analysis (Figure 1.8) to determine which hypotheses contributed to the predictions. Since the population is relatively less important to the outcome, there is no single point estimate for the population distribution assumption.
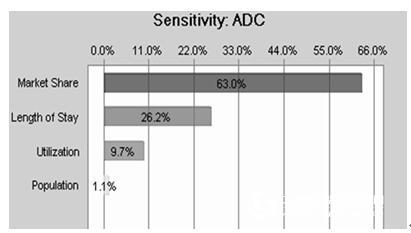
Figure 1.8 Sensitivity analysis
Quota Management A typical method used by the CMC Planning Department to determine bed requirements is to multiply the single point estimate of the number of admissions by a single point estimate of the length of hospital stay to determine the total number of days of hospitalization. The total number of hospital inpatients divided by 365 is the average daily number (ADC). The Poisson distribution is then applied to the ADC to determine the total bed demand. In addition to the single-point estimation problem, the Poisson distribution assumes that all patients arrive at an irregular time, so if any service department has an emergency admission, the bed needs to be estimated.
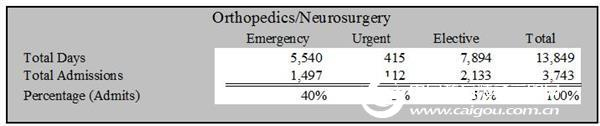
Because CMC classifies all hospitals by the urgency of bed demand, Stroudwater can analyze each category and identify many differences in the urgency of bed needs in different departments. The emergency factors for obstetrics and gynaecology are 100% and correction surgery, 57% of admissions are optional, see Table 1.2.
Table 1.2 Classification of Bed Needs by Disease Urgency
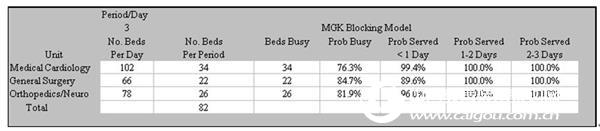
For in-depth analysis, the physician members of the committee met to determine which departments with natural similarities and care similarities could be merged. The Steering Committee then meets to discuss the service objectives for each type of admission. They are in favor of a bed that is immediately available in a "bursty" situation, with a bed in 48 hours in an "emergency" situation and 72 hours in an "optional" case. Using the multi-channel model developed by Dr. Johnathan Mun and Lawrence Pixley, the bed requirements for each major unit group were determined, see Table 1.3 and Table 1.4.
Table 1.3 Classification of Bed Needs by MGK Blocking Model
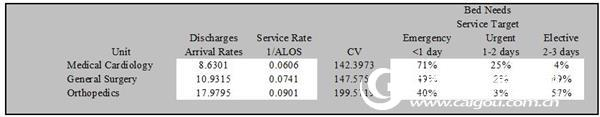
Table 1.4 Classification of bed requirements when considering bed utilization in the MGK Blocking model
The service department sets the distribution for bed utilization and market share to determine the required arrival rate in the queuing model. The service department also sets the distribution of hospital stays to determine the service rate in the input model. The prediction units in the Monte Carlo simulation are set to <1 day, 1 to 2 days, and 2 to 3 days to represent the respective "acceptance rate" for each case.
As a standard for its planning, the committee determined that more than half of the target confidence levels available for bed use were 95%. Stroudwater implemented an iterative process for the model and continued to run Monte Carlo simulations until it met the criteria. For example, at the 95% confidence level, the determination of the 75-bed requirement for the first run-time correction is 47.8%, while the second 78-bed determination is 60.57%. The second data is used, as shown in Figure 1.9.
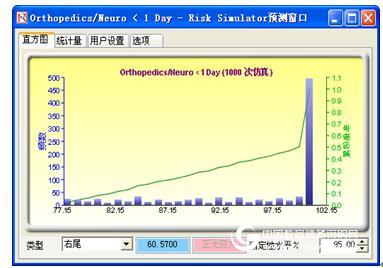
Figure 1.9 Frequency distribution of demand for 78 beds
Analysis result
The committee feels that building a new hospital near the target market will improve market share in key areas. The difference in bed demand at the two locations predicted in the Stroudwater study reinforces this perception of the Commission, as shown in Table 1.5.
Table 1.5 Analysis of Bed Demand Results of Existing Hospitals and New Hospitals
The project architect used the bed requirements information to complete the construction cost planning in both cases. If the demand for beds in the existing campus is 39 instead of the 95 beds that are predicted, the architect can design a space for 92 private rooms.
The architect estimates that the cost of a new hospital facility is $587000000, while the cost of repair/addition in an existing campus is $285000000. Fundraising for the new hospital program is estimated to increase by $125 million, asset sales income is $56000000, and therefore $231000000 is required for borrowing, while the existing district programme is estimated to require $110000000.
Those who agree to the new hospital program believe that the program has the following advantages:
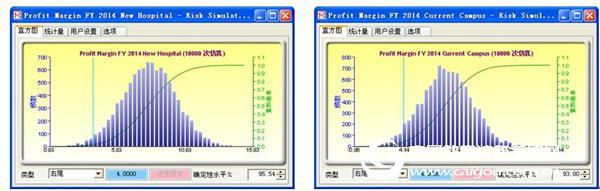
In the case of new hospitals, the income of unit patients and unit beds will increase, as the number of hospitals in the marginal sector is expected to increase. For example, the marginal cardiothoracic surgery unit contributed $11,600, while the urology department only cost $2,200. Under existing facilities, a single bed requires an average of 6.1 full-time equivalents (FTE), mainly due to the inefficiency of the facility. Stroudwater predicts that repairing existing homes will reduce the FTE to 6.0 for a single bed, but the new home will drop to a lower 5.8. The public cost per square foot is now reduced to $4.08 from $4.51, while maintenance costs per square foot will be reduced from $2.46 to $1.40. The loss of surgical accidents in the new hospital program will also be minimized. The neighbouring community assures us that if the hospital chooses to rebuild, they will not have difficulty in manufacturing, and the expansion plan may be delayed for three years due to continued opposition from the community in the existing district.In addition to the above-mentioned pros who showed (see Table 1.6, Table 1.7 for the opponent's expectations), Stroudwater submitted the results of the Monte Carlo simulation of the 2014 profit margin to the Board of Directors, as shown in Figure 1.10. Interestingly, the predicted profit margins are very similar in both cases, except that the probability of a profit margin exceeding 4% in a new hospital is slightly higher. As the results of the two programs were similar, the board voted to decide on a new hospital program. They believe that although there are risks in moving to nearby communities, the risk of staying at existing addresses will be greater. They realized that if the forecast underestimated the future service demand, the existing campus would limit their expansion plans, while the new hospitals would have more flexibility for emergencies.
Table 1.6 Financial expectations of Jianxin Hospital
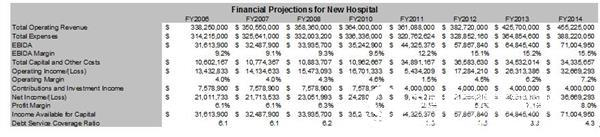
Table 1.7 Financial expectations for the expansion of existing hospitals
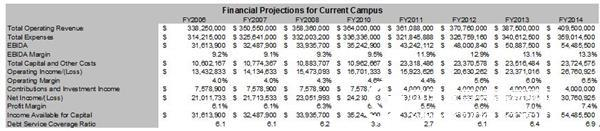
Figure 1.10 Monte Carlo simulation
A bond rating agency rated CMC's risk assessment method as good. The letter of recommendation made the following observations:
The CMC's decision-making process received high scores. The agency appreciates the alternative analysis of the two options and the special method of integrating uncertainty into the bed's needs. It pointed out that the analysis reduced the forecast of the original 515 bed facility to 489. CMC knows to include physicians in the steering committee and management to continually meet with medical staff to correct the analysis. The agency believes that moving the hospital to a new location is a risk because the original physician's office is being transferred, but for private ownership and the development of a 300,000-square-foot medical office building as part of a new campus, the risk is not mitigated. Aggravated (it points to a shortage of space for medical office facilities in existing hospital areas). It also agrees with the view that CMC's long-term financial capabilities have improved as the ability to hire and retain physicians in the future will increase, especially in large group operations. The new hospital will be built near the CMC Mobile Medical Center, which has been in full operation for six years, which is also commendable because patients have become accustomed to coming to this place. The agency also found management's convincing examination of all aspects of patient capacity, third-party compensation and its impact on income and liquidity.The following are the main advantages of using risk analysis in this case:
Many of the board members are familiar with the risk analysis of their own industry, and they are more willing to make relocation decisions based on some possible outcomes, rather than based on the aforementioned single point estimates. The bond rating agency gave the hospital a good rating because the “just in case†situation was taken into account and the methods used to identify and mitigate risk factors. Thanks to the more mature queuing model theory, the hospital was able to reduce the number of beds predicted and thus reduce the total construction cost.Chroma Key Green Screen,Retractable Green Screen,Mountable Green Screen,Green Screen Background
Dongguan Aoxing Audio Visual Equipment CO.,Ltd , https://www.aoxing-projectorscreen.com